Showing posts with label HSCEI chart. Show all posts
Showing posts with label HSCEI chart. Show all posts
Friday, January 15, 2010
HKSE Weekly Summary
SSECI: Congested movement. Need to break above 3250 for the next rally. Uptrend support is at around 3100.
HSCEI: Given a daily sell signal. Not good. However, no sell signal on the weekly chart. Therefore, should be just a normal correction. Look for support at around 12000 based on the weekly chart.
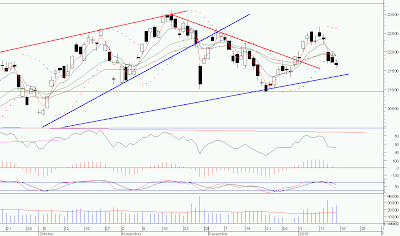
HSI: This is the base building that I talked about last week. It should not go down below 21400 (uptrend support line) to ensure that the base building is successful for the next rally.
Friday, January 8, 2010
HKSE Weekly Summary
The correction for HSCEI is over with the break of the immediate downtrend line. The next phase is to build a phase for the next rally up. Immediate resistance is at around 14000.
Same as HSCEI, need to build a base first before can move up higher. Base building level is at around 22000. If HSI can break 23000, then the next resistance is at 26000.
Subscribe to:
Posts (Atom)


